Annual Planning Season: Turning Strategy Soup Into a 2027 Roadmap Slide
It's October, which means "preliminary 2027 planning" just appeared in your calendar. Here's how to turn strategy soup into the one-page annual roadmap that survives January — and why quarters, not months, are the unit.
It's mid-October, which means a meeting called something like "FY27 Planning Kickoff" has materialized in your calendar, trailed by a strategy doc, three competing spreadsheets, and a Slack thread where every department quietly lobbies for headcount. Somewhere at the end of that process, one artifact has to exist: the 2027 roadmap on a slide. One page. The whole year. Something a leadership team can look at in January — and, crucially, still be looking at in June.
Q4 planning is a compression problem; annual planning is a compression problem with a forecasting problem stacked on top. Here's how to build the one-pager without pretending you can see December 2027 from here.
Why annual roadmaps die by March
The failure mode of annual roadmaps is almost never ambition. It's resolution.
A roadmap drawn at month-level precision for twelve months is an instrument lying about its own accuracy. Nobody knows what the week of August 9 looks like; drawing a bar that starts there anyway converts your roadmap from a plan into a prediction — and predictions get graded. By March, three bars have slipped, the slide is visibly wrong, and it quietly stops being presented. The roadmap didn't fail; its resolution did.
The second killer is the departmental food fight: a roadmap organized by team becomes a map of org politics, where every lane must contain something at all times to prove that team matters. Outcomes get sliced to fit reporting lines, and the slide reads like a seating chart.
The fix for both is the same discipline: themes as rows, quarters as the unit.
The annual grid: themes × quarters
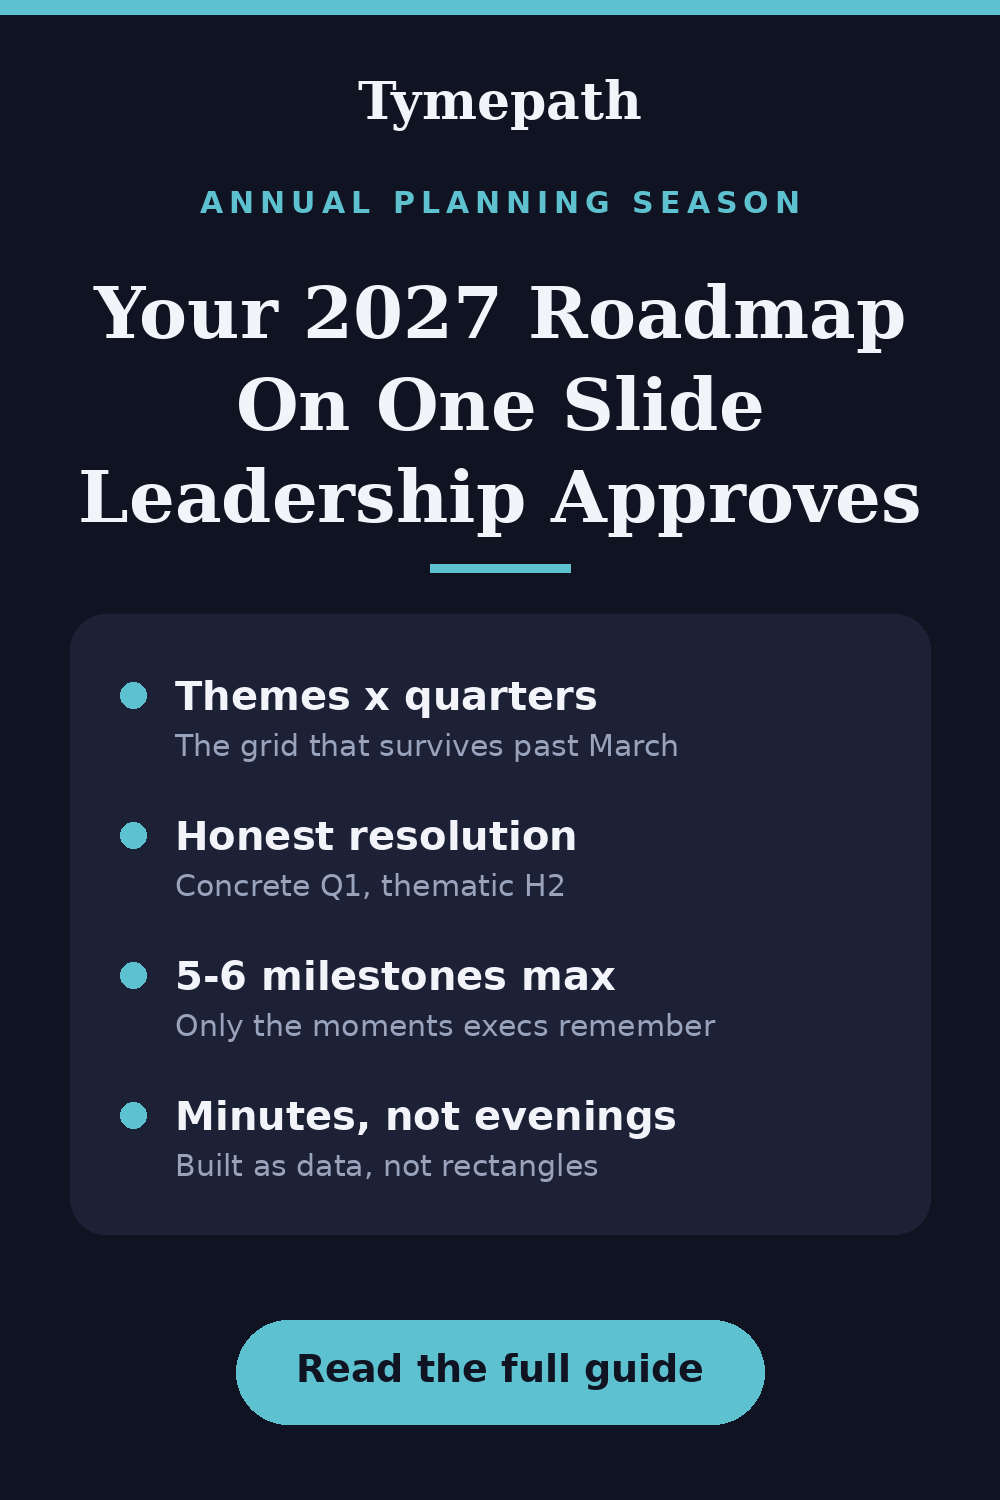
The annual roadmap that survives contact with a real year looks like a grid. Three to five rows, named for outcomes a board member would recognize — "Enterprise readiness," "New market launch," "Platform cost down 20%" — not team names. Four columns: Q1 through Q4. Inside, a dozen blocks, dated to the quarter.
The gradient matters more than the grid: Q1 should be concrete (it's ten weeks away; you genuinely know), Q2 directional, and the back half of the year honest about being thematic. "H2: international expansion, scope set after the Q2 launch review" is not vague — it's accurate, and senior audiences can tell the difference. Precision you don't have reads as either naivety or spin, and both get you the same skeptical follow-up meeting.
Three more rules that buy credibility: put diamonds only on the moments leadership will remember (a launch, a renewal, a compliance deadline — five or six for the whole year, not twenty); leave visible whitespace in Q3 or Q4, because a year with no slack is a plan nobody believes; and mark one thing as explicitly stopping. An annual plan that only starts things is a budget request wearing a roadmap costume.
Building the slide (and rebuilding it in February)
Here's where most annual plans burn an evening: the grid above goes into PowerPoint as hand-drawn rectangles, gets approved in January — and then February happens. A priority shifts, the Q2 launch moves, and now someone has to re-nudge twenty shapes or, more commonly, nobody does, and the official roadmap becomes a historical document by spring.
This is exactly the loop Tymepath is built to close. The annual plan lives as a task list — each block a row with a name, start, end, and theme; each diamond a milestone flag — in an editable table that sits next to the rendered slide. The build:
- Import what the planning process produced. Paste the block list, or upload the CSV or Excel sheet where the plan currently lives — each row becomes a dated block. (PDF import works too, if the plan is trapped in last year's deck.)
- Pick the annual roadmap view. Of Tymepath's 17 styles, the quarterly roadmap is the one built for this: themes as lanes, blocks rounded to the quarter so the slide stays board-height while the table underneath keeps real dates. The same data can render as a detailed Gantt later, when delivery teams need day-level truth — one source, two audiences, no second file.
- Export into the planning deck. Native PowerPoint slide, PNG, or PDF. It drops into the January deck next to the budget numbers, where annual roadmaps live.
- When February happens, edit two cells. The launch moved a quarter? Change the dates in the table and re-export. Thirty seconds. The roadmap stays a living document all year instead of a January screenshot — which, more than any design choice, is what makes leadership keep trusting it.
All of that is on the free tier, no credit card — a single company or product annual roadmap is squarely a free-tier job. Pro adds AI layout for genuinely messy pasted lists and program rollups, which earn their keep when you're consolidating six teams' 2027 plans into one steering-committee view.
The 10-second version
An annual roadmap is a promise about resolution, not just content: concrete Q1, directional Q2, thematic H2. Three to five outcome-named themes, quarters as the unit, five or six milestones, one visible gap, one thing that stops. Build it as data instead of rectangles, and the slide you present in January can still be true — and presentable — in June.
If you'd rather not start from a blank grid, the template gallery has an executive quarterly roadmap pre-loaded with sample tasks — swap in your 2027 themes and export.
Try Tymepath free
Turn your 2027 plan into a board-ready annual roadmap slide in minutes. Free tier, no credit card required.
Try Tymepath free